Market research tools are the cogs on which the insights industry turns; without the tools that insight professionals use on a daily basis, insight generation would be a lot harder. There are many significant tools spanning all stages of the market research process that find their way into the toolkits of insight teams in all industries, from research design, respondent recruitment, data collection and analysis, and insight communication.
And then there are tools that aren’t necessarily first in mind when we think about market research tools, and these tools are typically found. in the insight communication stage. So with that in mind, we’ve gathered twenty of the most useful market research tools for insight professionals spanning the entire market research process from design to activation, and have drafted in the valuable insight of Ian Goulding, who is Head of Insight Operations at NatWest.
In this guide, you’ll find a selection of tools throughout these stages of the research experience:
- Research Design and Respondent Recruitment
- Data Collection
- Data Analysis
- Insight Communication
- Bonus: Skills as Tools with Ian Goulding.
This is one of our longer articles, so if you’re looking for something specific then you can use the quick navigation links above to jump to each section of the guide.
| Tweet This | |
| Market research tools are the cogs on which the insights industry turns and there are many tools to choose between for each stage of the research experience. |
Research Design and Respondent Recruitment
These tools are critical to the preparation and pre-production of market research - from recruiting the right participants to planning and designing quality experiences.
1. Microsoft Word, Pages or Paper and Pen
Now, I understand starting this list off with a tool not actually dedicated to market research is unorthodox, but bear with me. Yes, Microsoft Word’s primary function isn’t to help insight teams design market research experiences or recruit the right respondents, however, the simple but effective research brief templates that can be created using this tool will only help insight teams and stakeholders communicate more effectively, understand the role each party will play throughout the market research process, and identify who the target respondents will be and how they might be best reached.
Not only this, but it is the most common tool used throughout the research design process to record brainstormed content ideas, take a variety of vital notes, draft up and edit scripts for focus groups and surveys, and much more besides. When we need to start something new, the first tool we open on the computer is usually Microsoft Word, Pages, or a similar application on a different operating system - or even just the good old-fashioned paper and pen.
Now, this sounds all like a bit of a stretch for a Microsoft Word document, but there are research brief templates like our own all made up and ready for those insight teams who need one. These templates are customizable so insight teams can set their own criteria and get the information they need from stakeholders to create the best research experience possible.
2. Email and CRM tools
When managing the recruitment all by yourself, email and customer relationship management tools can be a godsend when it comes to sourcing the right participants. In-house insight teams especially will be able to use this to access the business’ database of customers and consumers and use the recorded demographics there to filter out those that don’t meet the research criteria.
Once these people have been identified, one of the best ways to get in touch with them is through their email. In 2020, there were 4,037 million registered email users worldwide, and approximately 306 billion emails were sent and received every day that year. So, yes, while email is the most reliable source of communication when it comes to research opportunities, getting your email to stand out will be a skill well worth developing.
3. Social Media
For those insight teams who don’t have access to the business’ CRM, or the target respondents aren’t on the CRM, then the next best tool that many researchers turn to is social media. Social media is one of the most popular online activities, with 4.7 billion social media users around the world in October 2022 and an annual growth rate of 4.2% according to data.
With the average social media user holding an average of 8.5 social media accounts in 2018 and the number of social media users only increased since then, we can assume that there will be a significant amount of every target audience available for communication and recruitment. The trick is understanding which social media platforms are used most by your target respondents and using targeted adverts to gain their attention and recruit them.
Data Collection
Ready to start your research project? These tools are a critical part of the data collection process - helping you to gather the information you need to know in a quick and efficient manner.
4. Online Surveys
Surveys are and have always been, a staple in market research. They have been the go-to research task for many reasons, e.g., when stakeholders aren’t sure exactly what is best and need to find a starting point, when insight experts need to gather high-quality quantitative data from a significant sample, or to get an overview of the consumer experiences and consensus before diving deeper with qualitative research tasks.
Surveys have become the fall-back option for a while as the most iconic market research tool, but sometimes this has been to the stakeholders’ detriment as this quantitative tool has only been able to provide quantitative insights for the longest time; however, recent technological and research innovation has made it so that online surveys can actually be a safe fall-back option, with the inclusion of image and video responses to gather some qualitative data from this quantitative tool. Other recent technical innovations in surveys have revolutionized the scripting process to mimic flowcharts, making it easier for every stakeholder no matter their experience level to create an impactful survey.
While surveys are typically used as the main research tasks, they are often the first thing that respondents see in a research project, in the form of screener surveys. As a recruitment tool, online surveys function as a way to filter out unsuitable respondents and segment those suitable respondents that end up participating in the rest of the research.
5. Online Focus Groups – Synchronous
Online focus groups are the qualitative equivalent of surveys in that they are a staple of market research. And when we say ‘online focus groups’ the initial focus group type that usually comes to mind is the synchronous focus group, the original version that takes the format of in-person or online group discussions in the space of 60-90 minutes.
These focus groups are incredibly popular for a reason, they are a reliable source of verbatim thoughts, and shared stories of valuable experiences that result in raw, in-the-moment insights. These insights can be put to use immediately if stakeholders are observing the focus group, and/or close after once the final report is produced.
Focus groups have been around far longer than technology, but the technology available today has revolutionised the in-person focus group, allowing for that same face-to-face connection to happen regardless of where participants are in the world. This opens up a lot more opportunities to hear from different segments and how they interact with each other in less time than it would take to create an in-person focus group.
Asides from gaining direct access to the voice of the customer, synchronous focus groups can also be used to help refine the respondent recruitment process, as those that get through the screener survey can participate in user interviews to make sure they’re definitely the right fit for the research project.
6. Online Focus Groups – Asynchronous
While synchronous focus groups are considered the staple of qualitative market research, sometimes insight teams need qualitative insights at a more accessible pace. Still emotional data and instant connectivity, but without the instance and allowing the participants to think and provide well-rounded responses - that is where asynchronous focus groups come in.
Asynchronous focus groups typically take the form of question board research tasks, with set questions that allow for research participants to provide their answers over the course of multiple days, and once the answer is submitted they can then place comments on other participants’ answers to start a thread of proper discussion.
Because of the nature of these online asynchronous focus groups, they are able to contain a lot more respondents than synchronous focus groups, increase the anonymity of each participant and allow them to carry out multiple conversations at the same time, increasing their agility when providing valuable data. This means though that there are different management and moderation techniques needed to ensure the continuation of relevance throughout all discussions, sift through the comments to make sure they’re all engaging and non-offensive, and try to encourage all participants to take part instead of just a few while the rest hang back.
Once these techniques are in place, these asynchronous focus groups are usually just the right blend of focus groups and forums to stimulate high-quality data-rich conversations without the same strict time pressures experienced in synchronous focus groups.
7. Smartboards
Smartboards are interactive tools that facilitate group discussions around an image or set of images. FlexMR’s SmartboardMR tool includes features such as heat-mapping and sentiment tagging, to facilitate the marking up of images with participant commentary, allowing stakeholders to see exactly which parts of the image are good, bad, and neutral.
In this heat-mapping, participants can take part in collaborative discussions and explore each other points of view without too much prompting from researchers, leading to an organically evolving discussion. This can lead to great insights into collective customer experiences, but also insight experts can start the task off with individuals tagging their own sentiments and then participating in group discussions later on. Focus groups are a good task to pair with smartboards, as they provide an opportunity for stakeholders to ask questions based on the responses to the smartboard.
Smartboards can be used for a variety of different research projects; for example, insight teams can conduct A/B testing by using two smartboards to show two different designs to two different groups to understand the impact of the difference between the two designs. Obviously, everyone is different and has different tastes, but this can work out in our favour, as the differences in design can show stakeholders the reasons behind the preferences of the two different groups.
8. Polls - Quick and Open
Polls are another staple in market research and are one of the rare tools that can integrate into both quantitative and qualitative research strategies very easily. Quick polls are by nature, quick quantitative questions with multiple-choice answers - very easy for participants to answer in under thirty seconds. Open polls are questions with an open text box waiting for participants to type in a quick answer to the question - requires a touch more thinking than quick polls but is just as easy for gathering simple qualitative responses.
Polls are one research task that most consumers see and can participate in without fully understanding that they’re taking part in a wider market research project, for example, polls can be used as an NPS task, as this usually takes the format of choosing a rating on the scale and then provide a space to briefly explain why they chose that option.
Polls can be used in a variety of ways, for example, to recruit from an existing consumer base or research platform into a new research project, to start a discussion within a focus group research task, a ‘show of hands', and to boost engagement levels in research communities.
Data Analysis
Once you have collected your data, the next step is to translate it into meaninful results. That's what these following analysis tools will help you to do.
9. Predictive Analytics Tools
Predictive analytics is a technological tool that helps businesses make predictions about the future, by drawing on techniques such as data mining, machine learning and statistics. It’s used more in the field of data science rather than market research, but with the similarities in both industries and the clients we both serve, it’s not far-fetched to see the predictive analytics tools in the toolkits of market researchers.
Ian Goulding, Head of Insight at NatWest comments that he firmly believes “predictive analytics will play a major role across the insight industry and that, alongside this, there will be a greater need to understand and fully utilise organisational meta-data. In terms of impact on skillset, this will require insight professionals to be far more conversant and aware of data structures, and how best to use inputs such as internal operational data, commercial information, and market analysis.”
Ian continues, saying, “unlocking the power of big data is still an aspiration for many companies and I believe insight teams need to help to shape the strategy and the roll-out in this space. As core users of the data, insight professionals may need to become increasingly multi-disciplinary, with teams harnessing a greater range of skills and subject matter experts than ever before.”
| Tweet This | |
| Some of the tools in this top 20 list aren't dedicated market research tools, but they have ingrained themselves into the daily lives of insight experts everywhere. |
10. Online Quantitative Analysis Tools
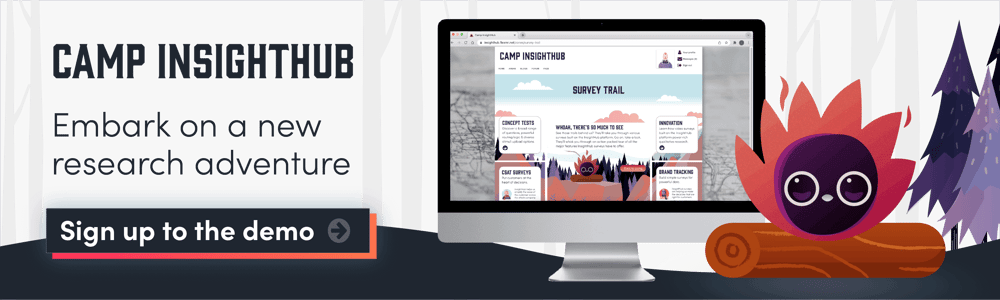
Some platforms like FlexMR’s InsightHub will have their own quantitative analysis tool, that draws on the data generated in the platform itself. This enables a self-contained research experience where recruitment, data collection, data analysis and insight generation/communication can happen all within the same platform.
For those platforms that don’t have an in-built quantitative analysis tool, there are online quantitative tools that can be integrated into an insight teams’ research technology stack, and the data imported into that software can be analysed thoroughly in the methods programmed into that online tool.
However, data security is a risk that will need to be averted. Whatever online quantitative analysis tool insight teams use will need to be properly vetted to understand what risks are associated with it when uploading sensitive personal data. Any online tool should have the relevant security qualifications to support an insight team’s use of the tool in all research experiences from general to sensitive.
11. Q Software
Q is a downloadable data analysis and reporting software, primarily used to analyse quantitative data from surveys. This particular tool is used by many insight teams globally as it operates throughout all stages of data analysis from data cleaning and coding to data visualisation and analyses.
Getting a tool like Q that does all of this really helps cut down the analysis time for insight teams, as they can focus on the analysis stage rather than having to sift through tonnes of data to clean and sort it first. This creates a quicker, agile approach to data analysis, with insight experts diving straight into the data, producing graphs and charts to generate insights and find ways to communicate them with stakeholders.
Every analysis tool will perform through their own programming language, so downloading one that is intuitive will help insight professionals by not having to learn yet another programming language to generate insights. Q also exports the results into formats compatible with Microsoft Office and online viewing.
12. Spreadsheet Software
Microsoft Excel, Numbers and any other spreadsheet software is a tool that every insight professional has access to and uses on a daily basis. Whether that’s for creating content calendars in the research design stage or analysing the data once it’s been created, Microsoft Excel or a similar tool in different operating systems can be classed as an essential tool to any insight professional.
Microsoft Excel in particular is used as default with Windows operating systems and has evolved over time from a documentation software to a true analytical tool that can learn patterns and organise data to save researchers time. Using embedded algorithms, insight experts can manipulate and compare datasets, and use visualisation techniques to reveal many insights.
Microsoft Excel in particular is compatible with numerous other analytical software, such as Q, which means that most analytics tools can export data into office-compatible formats, to make it easier for insight experts to compile analysed data sets from different sources into a single report.
13. Text Analysis Tools
Text analysis methods such as thematic analysis and semiotic analysis are key to getting the most out of insights, but human error is always an issue and computers are great at pattern spotting, so while the computer algorithm is scanning for patterns, human researchers can dive deep into qualitative analysis to gain valuable insights.
Through technological innovation, computers have come to play a larger role in qualitative text analysis, using machine learning algorithms such as natural language processing methods to mine the text and spot patterns and trends within the data, sort the data and clean it up where necessary. This takes a lot of the pressure off insight experts so they can get straight to analysing the text, drawing out insights and applying relevant contextual knowledge to create rich, relevant, and directly actionable insights. Of course, that doesn’t mean that computers can’t also make mistakes. Casting a human eye over the results will help eliminate the chances of computer and human error.
Text data can come from many sources, for example, surveys, video transcripts, live chat focus groups, question board tasks, social media posts and comments, online customer reviews, emails, and employee or researcher notes at least.
14. Transcription Tools
Obviously, before recorded videos and audio can be analysed by text analysis software, they need to be transcribed. Sometimes, if the transcription is happening in real-time on a research task such as an online focus group, it ends up being the only record of the focus group once it has concluded.
Having these data formats transcribed into text format can mean the difference between a relevant, accurate insight, and an insight that just misses the mark, and that is because we sometimes miss things when someone is talking or someone else is interrupted or our attention is otherwise diverted. These transcriptions help insight experts to follow along and spot words or phrases that speak volumes, which they might have otherwise missed.
There are some video analysis tools that have transcription functionality built-in, but otherwise, there are many dedicated transcription tools and agencies ready and waiting for insight experts to take advantage of them.
15. Video Analysis Tools
Video content analysis is a method that can be quite tricky, especially for insight experts who are more used to analysing text and numbers. But there are tools out there to help us get it right, for there is a lot more to a video than simply what a participant is saying. At the very least tonal analysis can help insight experts understand more about the emotion behind a participant’s words, and then there is also AI video analysis software that can help us track facial expressions and movements to uncover more about a participant’s emotional state while they’re being interviewed and recorded.
Capturing this data is only the first step and these little nuances can be easily missed if the researcher gets distracted during analysis. FlexMR’s video analysis tool is another example of a simple video analysis tool;. while VideoMR doesn’t have facial recognition and AI-based emotional analysis to offer, it does hold a lot of features to enhance and streamline an insight expert’s analytical endeavours. It takes the analysis stage one step further into the reporting stages, as it is designed to facilitate fluid reporting and sharing of consumer video content.
VideoMR has the capacity to store video content from a variety of InsightHub sources, and an editing suite that insight experts can use to create montages, clips edited together to form engaging stories for stakeholder consumption.
Insight Communication
The final step of the market research process is often overlooked. It's not enough to collect and analyse data. To successfully inspire change, you need a robust set of tools to communicate and share your findings.
16. Data Warehouses and Dashboards
Data stores, sometimes called data warehouses, are online servers filled with historical data and details of previous research projects, which are constantly being updated every time new data is generated by insight teams. These stores are usually used, not to preserve the data, but to be used as an archive for whenever stakeholders might need access to on-demand insights on a particular topic - democratising access to data and insights.
Data dashboards can be a separate tool or used as the front page of a data store. These tools are used by stakeholders and primarily in-house insight teams to track, analyse and communicate data, allowing the user to compare datasets through the visualisation function and manipulate it to reveal potential new insights.
Creating these data stores with the dashboard user interface is a huge undertaking, especially for an established company with lots of historical data to try and log. However, it has been undertaken by some notable organisations, and the stakeholders across that organisation are currently becoming more empowered than ever before - if they use the data store with any regularity to influence their decision-making processes. Because even if a data store is there and ready for use, encouraging stakeholders to use it is another challenge entirely.
17. Process Mapping Software
Process mapping is probably not the first insight communication technique that comes to mind, or even the second. But it is a highly useful tool that uses customer experience and business strategy techniques as well as design thinking practices to help identify where problems and opportunities occur within an internal process. It is a visual representation of a process that is easy to follow and can be followed by everyone involved in the project.
Once it’s down on paper, it’s easy to see where the issues might lie, but this process mapping tool could be used in any of the stages for customer experience research in particular. I have put it in this insight communication section, however, because when research is done on a particular aspect of the process that is mapped, and there have been actions taken to change it, the map evolves based on the insights that insight teams feed it, and through that new issues, redundancies and opportunities reveal themselves.
Each change is visually obvious in the process map and provides a tangible metric to measure success by. This cycle continues until the process mapped out is relatively free of issues and all customers report being happy with their experiences.
18. Microsoft PowerPoint or Similar
This tool is simultaneously a curveball and not a curveball, as no one expects the humble Microsoft PowerPoint or similar to make an appearance in a list dedicated to the top market research tools for insight professionals. But this thinking is solely based on the fact that it’s a communication tool rather than an insight generation tool. Insight communication is just as important as insight generation, and that’s because no insight is impactful and actionable unless it’s communicated in a way that grabs the audience’s attention and motivates them to act.
Now, insight teams have been using Microsoft PowerPoint for years to create reports as it has a great user interface, is easy to understand and has a lot of versatility. But it’s always good to understand that we can do a lot more with simple tools than we have been led to believe. Many of us are used to the simple transitions and creation of shapes to jazz up a report, but we can do a lot more than previously understood with this creative communication tool.
We can use PowerPoint to make simple videos, animations and images. We can use PowerPoint to act as a whiteboard for in-person insight communication and activation brainstorming, we can use effects and simple, non-standard transitions to grab the attention of stakeholders and draw it to certain elements at certain times to increase impact and focus.
19. ActivateMR
It would be remiss not to mention a brand new tool in the market that solves vital problems when it comes to stakeholder engagement in insights - ActivateMR. This tool completes the circle, allowing for all research stages to be completed on the InsightHub platform itself.
ActivateMR allows users to curate data from across the InsightHub platform and build collaborative boards that can then be accessed and used as the focal point of discussions throughout stakeholder organisations. These boards put together by researchers can contain both quantitative and qualitative data, as well as report text explaining the significance or drawing attention to certain points. Video montages can be featured in a prominent position to capture stakeholder attention and multiple stakeholders can view them at the same time.
Discussions between stakeholders can happen online on the report itself through the comment function, so stakeholders can share their thoughts and what decisions they’ve used particular datasets and insights to influence. Some great use cases for ActivateMR are to create a new format for insight reporting, hold interactive workshops to help stakeholders build data fluency, and have insight retrospectives that dive deep into a long-term insight library and explore recurring themes and trends.
20. Instant Messaging Platforms
Finally, the last tool I would like to mention are direct instant communication tools that most in-house insight teams will already have access to, but likely aren’t using to the fullest potential. In a previous FlexMR roundtable, insight experts from different industries reported using internal instant messaging platforms to compensate for the lack of connection and communication with stakeholders across the organisation. Through these platforms, everything insight teams share on there can be discussed and engaged with through the comment, reply and reaction functions.
Because of the versatility of instant messaging platforms, insight experts can communicate through a variety of mediums, such as:
- Regular insight newsletters keep stakeholders in the loop with the research currently being run and the insights thus far. The capabilities and news items within the insights team to take into account when requesting research that month, day or quarter.
- Eye-catching image-based infographics display the most notable insights from a research project or group of research projects if there have been many in a short space of time. Each infographic can help keep insights in the mind of stakeholders if shared regularly enough.
- Video montages from tools such as VideoMR. These videos can be short clips of consumers sharing their experiences, poignant opinions and any interesting ideas, either an extended clip of one consumer or short clips of two to three at regular times can help keep stakeholders connected to consumers at all times.
| Tweet This | |
| The definition of 'tool' can be interpreted as 'skill', and Ian Goulding, Head of Insight at Natwest has some key skills that insight experts should develop now and in the future. |
Understanding Skills as Tools
However, the definition of ‘tool’ can be interpreted in a wider sense to mean skills, which are the tools insight experts tap into every day to create intensely valuable research experiences. Ian Goulding expresses this well by saying, “I don’t personally believe that there are core skills which are suitable for every insight role. From a client-side perspective, it’s fundamentally important for people to be great storytellers, strong influencers, and consider outcomes as opposed to outputs.
Now, within this, there is a requirement to be grounded in core quant, qual, and written skills. Over my time at NatWest, we’ve made a deliberate decision to create a team with a blend of skill sets, and we’ve also recruited people from a non-insight background. My observation would be that the people who deliver the most impactful research regularly use the insight toolkit in a dynamic way, often picking and choosing which techniques are needed for a specific project in order to drive powerful action (as opposed to simply returning to a tried and trusted formula). For me, this is the key part of the “tools” question. Rather than thinking about tools or techniques as being staples (or indeed as the final output), we should be considering how we get researchers to focus on the outcomes of a project - and that those outcomes should involve direct, a measurable activity that benefits both the business and the customer.”
When asked to look into the future, there are two skills Ian believes will make their way into the ‘staple’ category for insight professionals:
“In my opinion, there remains a gap between insight/research and true customer experience-led thinking. Quite often we see these role profiles as distinct from one another; the insight team will focus on things like surveys, focus groups, etc, whereas the CX team may be producing journey maps or getting close to a front-line understanding of processes. I believe that these two skill sets (along with behavioural science) will need to merge, or at least work together more closely, in the future. Rather than seeing these as separate types of roles, traditional insight professionals may need to step out of their comfort zone a little to experiment with new tools and techniques. In very simple terms, market researchers and insight professionals should be using any tool that helps organisations to create great business and customer outcomes, rather than worrying about whether a specific technique falls under their remit.”