No research method has been used more than the survey, with focus groups pulling up a close second. Surveys are, and always have been, one of the more robust and reliable tasks in the modern market researcher’s arsenal. And because of this, everyone knows how to write a survey, right? It’s just a bunch of questions on a page so what could be easier? Of course, as insight professionals, we know that statement is far from true, as the research design process and survey scripting skills involved in creating an effective survey are far from simple.
Current Scripting Processes
There are numerous hard-wrought skills that researchers need in order to craft an impactful and effective survey that will provide exactly the data they need.
From making sure you’ve covered all the questions you need to ask on a topic (but not asking more than necessary), to organising those questions into a coherent experience for the user to guide them through their thinking around the topic, and making sure the relevant users see the appropriate questions for them; the process of survey scripting is skilled and involved. That is all just in the design stage of survey scripting, which requires a certain creative knack. Implementing the written survey and routing it in a system that changes and has it’s own language is another matter entirely and requires many more technical logic and coding skills.
Traditionally, survey writing is quite a linear process: you might brainstorm a list of questions in a word document, then work out which users should answer each one in turn. This is largely what forms the traditional face-to-face or telephone-based origins of surveys.
Dangers and Consequences of Mal-Scripting
While researchers have been practising this particular approach for decades now, there are dangers that we all still face on a regular basis:
- The chance of ‘dead end’ questions that no one can answer increases exponentially.
- We can’t see the wood for the trees in terms of balance and flow of the questions and the whole survey.
- We risk repetition which bores participants, and omission of important questions which could mean the different between insightful quality data and damning knowledge gaps.
The consequences of these dangers impact the researcher, the client or business using the data, and the consumers themselves, all on a variety of levels. For the researcher, using lesser quality data leads to misinterpretations of reality, and thus, unactionable insights drawn from the data that could have easily been disproved with the data that they are lacking. A researcher’s job is to present the truth in it’s rawest form, and that simply cannot happen without all of the quality data that is needed.
Businesses rely on the data from the researcher in order to action informed decisions; if they are using the information properly, then they are basing important decisions on intrinsically flawed insights. Those business decisions will ultimately fail, or if they turn a profit, then it will be a very small one and be very accidental.
The consumers that provide their data expect enhanced experiences in return. If the data is fundamentally flawed then the experience that is based upon it will be flawed in return. The experience will not be what the consumers want, and that will reflect badly on the brand who created the experience and the researcher that advised them.
However, these dangers and their consequences could be eliminated with a more intuitive, visual approach to designing and programming surveys.
Flowchart Survey Innovation
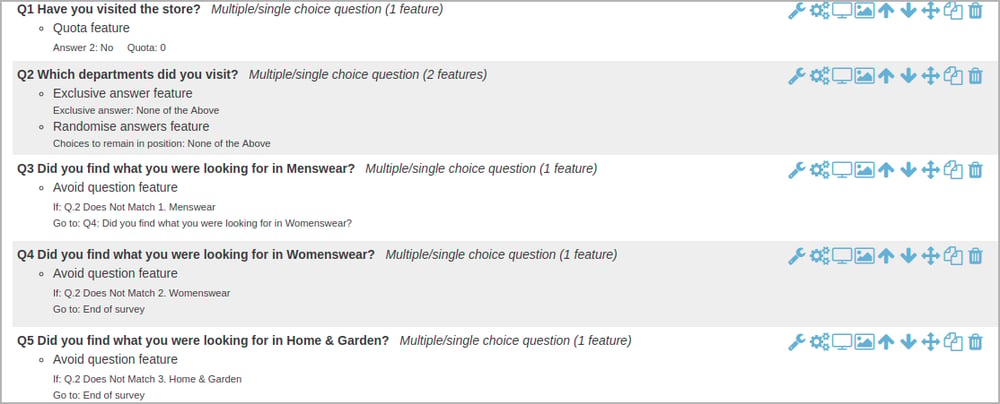
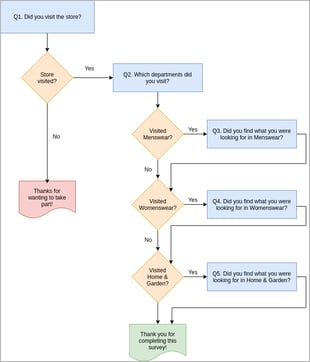
We have designed a survey scripting tool, SurveyMR 2.0, which features a flowchart interface with all of the benefits contained therein. It is a flexible canvas in which researchers can organise their ideas; this interface allows the user to drag their questions and logic around without breaking the routing, and group related pages and questions together. With the ability to zoom in and out of the survey interface, the user can now see an overview of all their questions and routing logic in one go. This can be a handy way to highlight areas of your survey to build further on. Further benefits include, but are not limited to:
Separation of content and logic - Split your work between routing and question setting in whatever way you're most comfortable with. By having logic separate from content, you can build your survey in any order you see fit; and you can go back and make changes without putting your routing at risk.
At-a-glance understanding of branching and convergence - You know exactly where a participant's journey can take alternative paths without having to dig through each question and figure out each step yourself. If you do ever get lost, just follow the arrows.
Human-first design - Setting surveys with currently available technology can often be a frustrating experience. Survey software usually presents your questions as a flat list, and expects you to keep track of the customer-facing UI, the routing logic, the page breaks, and any themes or customisation yourself. Flowchart based UI separates these into discrete, manageable nodes that you can build one at a time. It lets the software handle the hard work so you can focus on what's important - delivering an engaging and insightful survey.
Pick up from where you left off - Writing a survey takes time and focus. Modern work environments often feel like they are doing their best to redirect your focus to other important tasks. While a flowchart can’t protect you from these distractions, it can help you get back on track quickly. You’re able to see where you were up to and so can pick it straight back up. Or you can decide to work on a different section entirely. The choice belongs to you, not the software.
Sketchers can skip a step when needed - When planning their surveys, some people prefer to sketch out their intended flow with a dependable pen and paper. This allows them to think about question placement and how to effectively direct users through a survey before they enter it into their software. A flowchart-based interface allows these people to do this sketching within the software itself.
They keep the benefits of pen and paper, while also gaining the inherent benefits of a software GUI. You’re able to draw your connections and change your mind as much as you please. Adding questions to a particular section doesn’t commit you to that decision, you can always move them later. Having second thoughts about some planned routing? Just delete the connections without having to also delete any questions or logic. You don’t have to get it right the first time.
The Future Flows
Redesigning the survey scripting process in this way makes creating surveys so much more accessible to everyone who wants to conduct research. Researchers and non-researchers alike, can easily understand and create impactful surveys in order to gain insights right there and then, as and when they need.
Opening out research strategies such as this to everyone within a business, not just the research department, then the usual internal business barriers and departmental silos that typically arise due to a lack of knowledge in market research can be brought down. As a direct result of this new way of creating surveys, all of the consequences of any decision made within a business can be quantified and fully visualised, which means that businesses can make fully-informed decisions at every twist and turn.